Through this piece, I wanted to share some of my knowledge on inflation as a driver of asset returns, and its outlook.
Driver of Returns:
On a fundamental level, inflation affects the price of future consumption, and thus how we behave as consumers. If the price of something is expected to rise in the future, we would naturally tend to gravitate more towards buying it today. In investing terms, it affects the rate at which we would be required to hold cash rather than consume it. In other words, we need to get a sufficient return on our investment that would persuade us to hold our money there, as opposed to spending that money now.
Although I have not back-tested it myself, research from firms like Bridgewater Associates, and Hedgeye Risk Management, have concluded that alongside economic growth, inflation is one of the two most important macroeconomic factors that drive asset returns. With that being said, I look forward to being able to back-test the data myself once I gain the necessary skills.
Effect on Particular Asset Classes:
What typically works within different inflationary environments?
Rising Inflation:
- TIPS (or other inflation protected bonds)
- Commodities
Falling Inflation
- Equities*
- Nominal Bonds**
- US Dollar
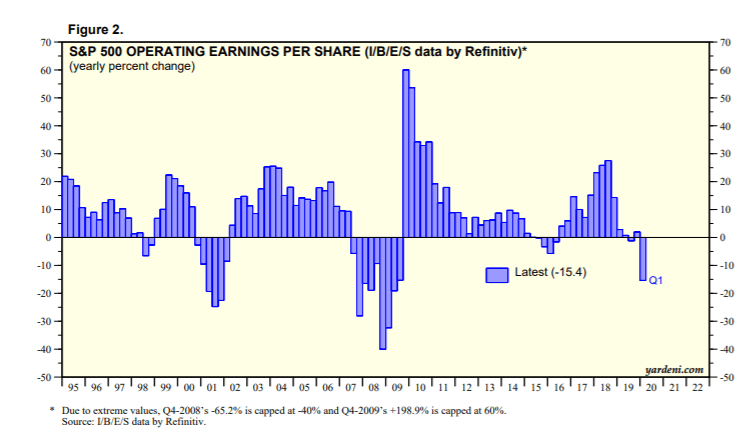
*Equities are a special case because they are largely dependent on economic growth. In environments with slowing growth AND falling inflation, we have seen two market crashes in the past two years (Q4 2018 & Q1 2020).
**Similar to equities, nominal bonds, in particular US treasuries, are largely dependent on growth expectations. Even in a deflationary environment, if economic growth is projected to be strong, the price of treasuries and notes will not necessarily appreciate.
Current Inflation Cycle:
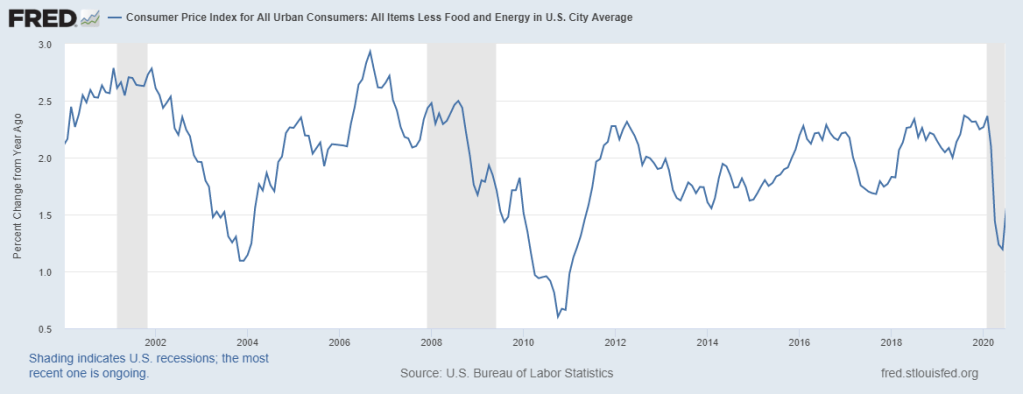
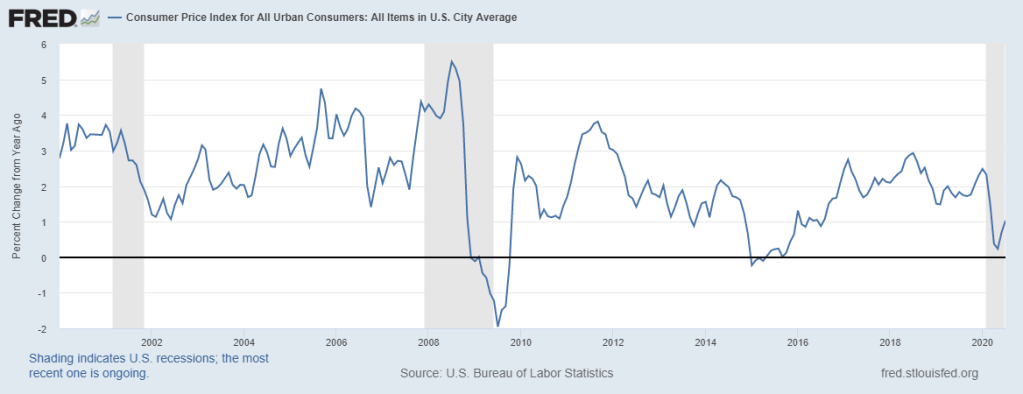
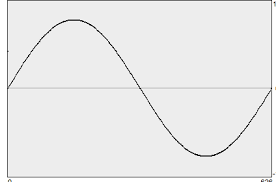
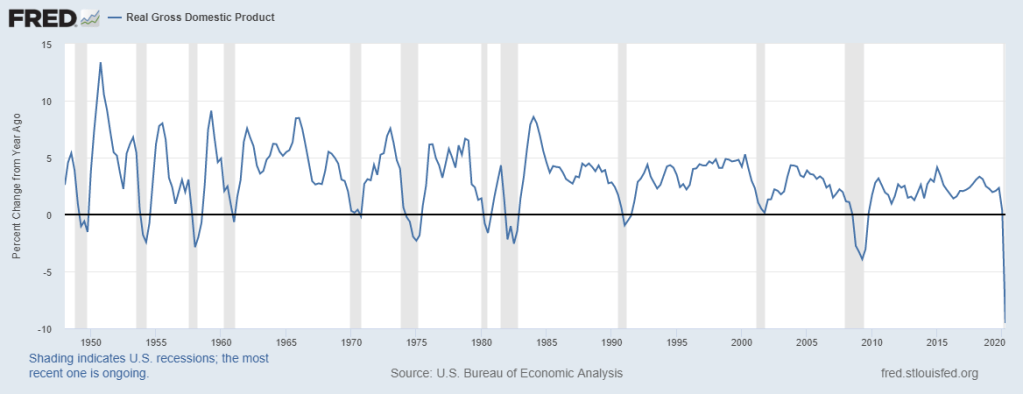
Like GDP, inflation on a Y/Y basis behaves in sinusoidal-like way. This means you have cyclical peaks and troughs in inflation. This is more evident in the Core CPI number displayed in Figure 1, as its Headline Counterpart is far more volatile due to food and energy. At least for the near term, it seems highly improbable that we will retest or go lower than the lows we have experienced this year on a Y/Y basis. We had an extremely deflationary force in the economic shutdowns seen across the globe, so much so that it made crude oil futures go negative for May’s contract. As a result, the most likely scenario is higher Y/Y inflation for the following few quarters.
Data that helps point in this direction is given to us via the CRB Index. Given that its biggest weight is oil, it suffered an incredible drop all the way to April. However, since then it has had a strong upwards trend, and oil has similarly seen a strong price move paired with falling volatility (OVX). Given that the items in the CRB Index affect the cost of living of the people, it is at least worthy to be considered in this analysis. With strong momentum and inflation rising on a Y/Y basis, it is highly probable that the CRB Index continues to climb higher in the near term.
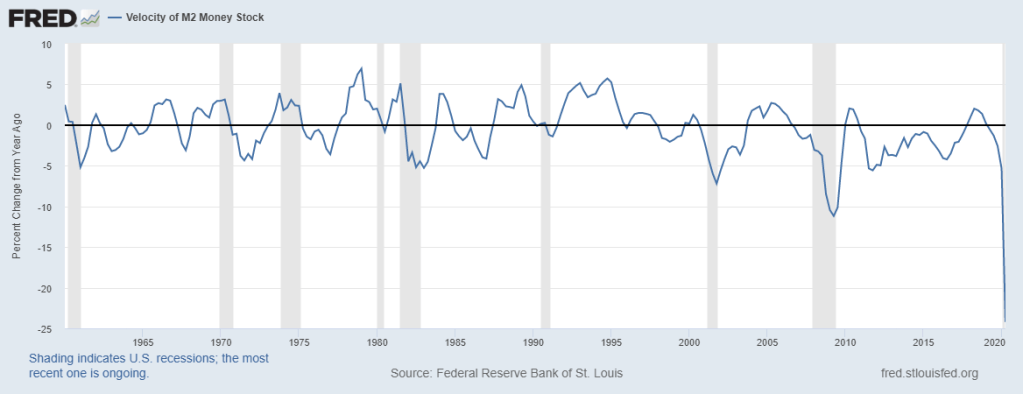
Lastly, I wanted to include this (M2) velocity of money chart. I included a much larger time series for this chart to provide additional context as to how unprecedented the current data is.
Money velocity and inflation are linked, so it will be key to watch if this data bounces for Q3 2020. The likelihood of the directional change in Y/Y inflation largely depends on this figure above.
Conclusion:
The biggest takeaway from this should be that the more probable scenario, at least in the next few quarters, is to see inflation rise on a Y/Y basis. I also want to highlight that this analysis was done without mentioning the recent Fed policy announcement, in which they stated that they would be more lenient in their inflation targets. When making these sorts of analyses, one wants to be able to front-run the Fed, and not just be at their whim.